Trusted by

Business runs on connections. We turn yours into clear signals. edgelayer is the augmented-intelligence layer that becomes part of your data fabric.
From reactive to predictive. Using the data you already have.
edgelayer transforms any database into relationship-aware, actionable intelligence that predicts outcomes and explains why.
Departments stream data into edgelayer’s graph engine. Insights flow back out to the people who can act, closing the loop from the warehouse floor to the executive table.
Most organisations are data-rich but intelligence-poor.
Dashboards explain what already happened. What's coming, and why, stays invisible.
Your business is a network of customers, contracts, suppliers, and staff. Most tools flatten it into tables, losing the relationships that drive outcomes.
Graph and predictive AI today means PhDs, feature-engineering teams, and seven-figure platforms.
The result? 87% of ML projects never reach production, and data teams spend ~70% of their time on plumbing, not insight.
Graphs over spreadsheets. Explanations over black boxes. Your stack, not someone else’s.
Move beyond rows and columns. edgelayer turns your relational data into a graph and uses Graph Neural Networks, built without specialist expertise, to surface relationships flat analytics can't see.
Point to your data, name what you want to predict, and edgelayer handles the rest. Every prediction comes with plain-English reasoning, so the answer is defensible, not a black box.
Plug into Snowflake, Databricks, or whatever you already run. Models keep themselves fresh, set it once and accuracy compounds as new data arrives.
From database to decisions, no code, no PhD, no AI team required.
Pull data from anywhere, Salesforce, CSVs, email, databases, into a single platform. Credentials stay encrypted; your data never leaves your environment.
Every model run becomes a plain-English report, risk categories, the accounts that matter, and the exact signals behind each call. Scroll through a sample.
%20rotate(58)'/%3e%3crect%20class='cls-1'%20x='38.08'%20y='115.78'%20width='76.3'%20height='4.07'%20transform='translate(135.75%20-9.27)%20rotate(58)'/%3e%3cpolygon%20class='cls-1'%20points='51.46%2036.51%2013.29%2014.97%2016.35%2013.45%2051.09%2032.73%2051.46%2036.51'/%3e%3cpolygon%20class='cls-1'%20points='80.27%2047.53%2062.23%2040.92%2064.1%2037.95%2080.02%2044.36%2080.27%2047.53'/%3e%3cpolygon%20class='cls-1'%20points='122.56%2074.86%2088.78%2049.99%2091.34%2048.04%20122.2%2071.09%20122.56%2074.86'/%3e%3cpolygon%20class='cls-1'%20points='147.8%2090.33%20127.3%2076.48%20129.85%2074.53%20149.29%2087.94%20147.8%2090.33'/%3e%3cpolygon%20class='cls-1'%20points='58.1%2040.53%2057.1%2082.47%2053.62%2081.87%2054.79%2043.37%2058.1%2040.53'/%3e%3cpolygon%20class='cls-1'%20points='27.69%2056.82%2058.7%2085.09%2055.96%2087.33%2027.67%2061.18%2027.69%2056.82'/%3e%3cpolygon%20class='cls-1'%20points='88.28%2050.47%2099.31%2095.89%2096.16%2096.11%2085.83%2054.07%2088.28%2050.47'/%3e%3cpolygon%20class='cls-1'%20points='100.84%20104.51%20100.55%20151.25%2097.44%20150.7%2097.58%20107.41%20100.84%20104.51'/%3e%3cpolygon%20class='cls-1'%20points='97.25%2015.22%2056.23%2037.62%2055.21%2034.64%2093.14%2013.78%2097.25%2015.22'/%3e%3cpolygon%20class='cls-1'%20points='102.74%2012.7%20142.65%2037.02%20140.58%2039.4%20103.55%2016.98%20102.74%2012.7'/%3e%3cpolygon%20class='cls-1'%20points='90.04%2044.47%20136.46%2039.07%20136.29%2042.22%2088.26%2047.35%2090.04%2044.47'/%3e%3cpolygon%20class='cls-1'%20points='144.08%2040.72%20143.79%2087.46%20140.69%2086.91%20140.83%2043.62%20144.08%2040.72'/%3e%3cpolygon%20class='cls-1'%20points='145.01%2037.04%20121.39%2077.37%20118.98%2075.34%20140.74%2037.92%20145.01%2037.04'/%3e%3cpolygon%20class='cls-1'%20points='56.93%2083.93%2099.51%20103.21%2097.74%20105.82%2058.25%2088.08%2056.93%2083.93'/%3e%3cpolygon%20class='cls-1'%20points='97.06%20102.91%20140.19%2084.91%20140.9%2087.99%20101%20104.77%2097.06%20102.91'/%3e%3cpolygon%20class='cls-1'%20points='126.63%2068.64%2098.92%20106.28%2096.74%20104.01%20122.3%2069.07%20126.63%2068.64'/%3e%3cpolygon%20class='cls-1'%20points='189.5%2012.82%20150.14%2038.03%20148.91%2035.12%20185.29%2011.67%20189.5%2012.82'/%3e%3c/svg%3e) Insights Report
Insights Report
Executive Summary
28 of your 342 active accounts are likely to churn within 90 days. The model ranks every account by risk so retention can focus on the $1.8M most exposed, each prediction comes with the signals that drove it.
Risk Distribution
Top At-Risk Accounts
| Account | Risk | Primary signal |
|---|---|---|
| Atlas Components | 0.93 | Orders ↓ 38% + 3-hop supplier delay |
| Vertex Logistics | 0.89 | Payment delay up 40% over 90d |
| Harbor & Co | 0.86 | Support tickets spiked, usage down |
| Solstice Media | 0.74 | Renewal overdue, engagement flat |
| Ironwood Retail | 0.71 | Login recency slipping |
What's Driving the Predictions
Summary: accounts whose payment delays are rising, with a recent spike in support tickets and falling order frequency, are 4.3× more likely to churn within 90 days, and the graph caught the supplier-delay link two relationships away.
Data Foundation
Completeness 0.94 · Integrity 0.98 · Accuracy 0.96, no manual schema mapping required.
Recommended Actions
Sources: accounts, orders, invoices, support_tickets, suppliers · 3 graph hops · Confidence 0.91 · Generated by edgelayer
Export to Tableau, Power BI, Looker, or pull the same report via API.
edgelayer turns your documents and databases into a knowledge graph you can query in plain English, with source attribution for every answer.
Upload documents, connect databases, and edgelayer automatically builds a knowledge graph, extracting entities, relationships, and context.
Then simply ask questions in natural language. Every answer traces back through the graph with full source attribution, so you know exactly where insights come from.
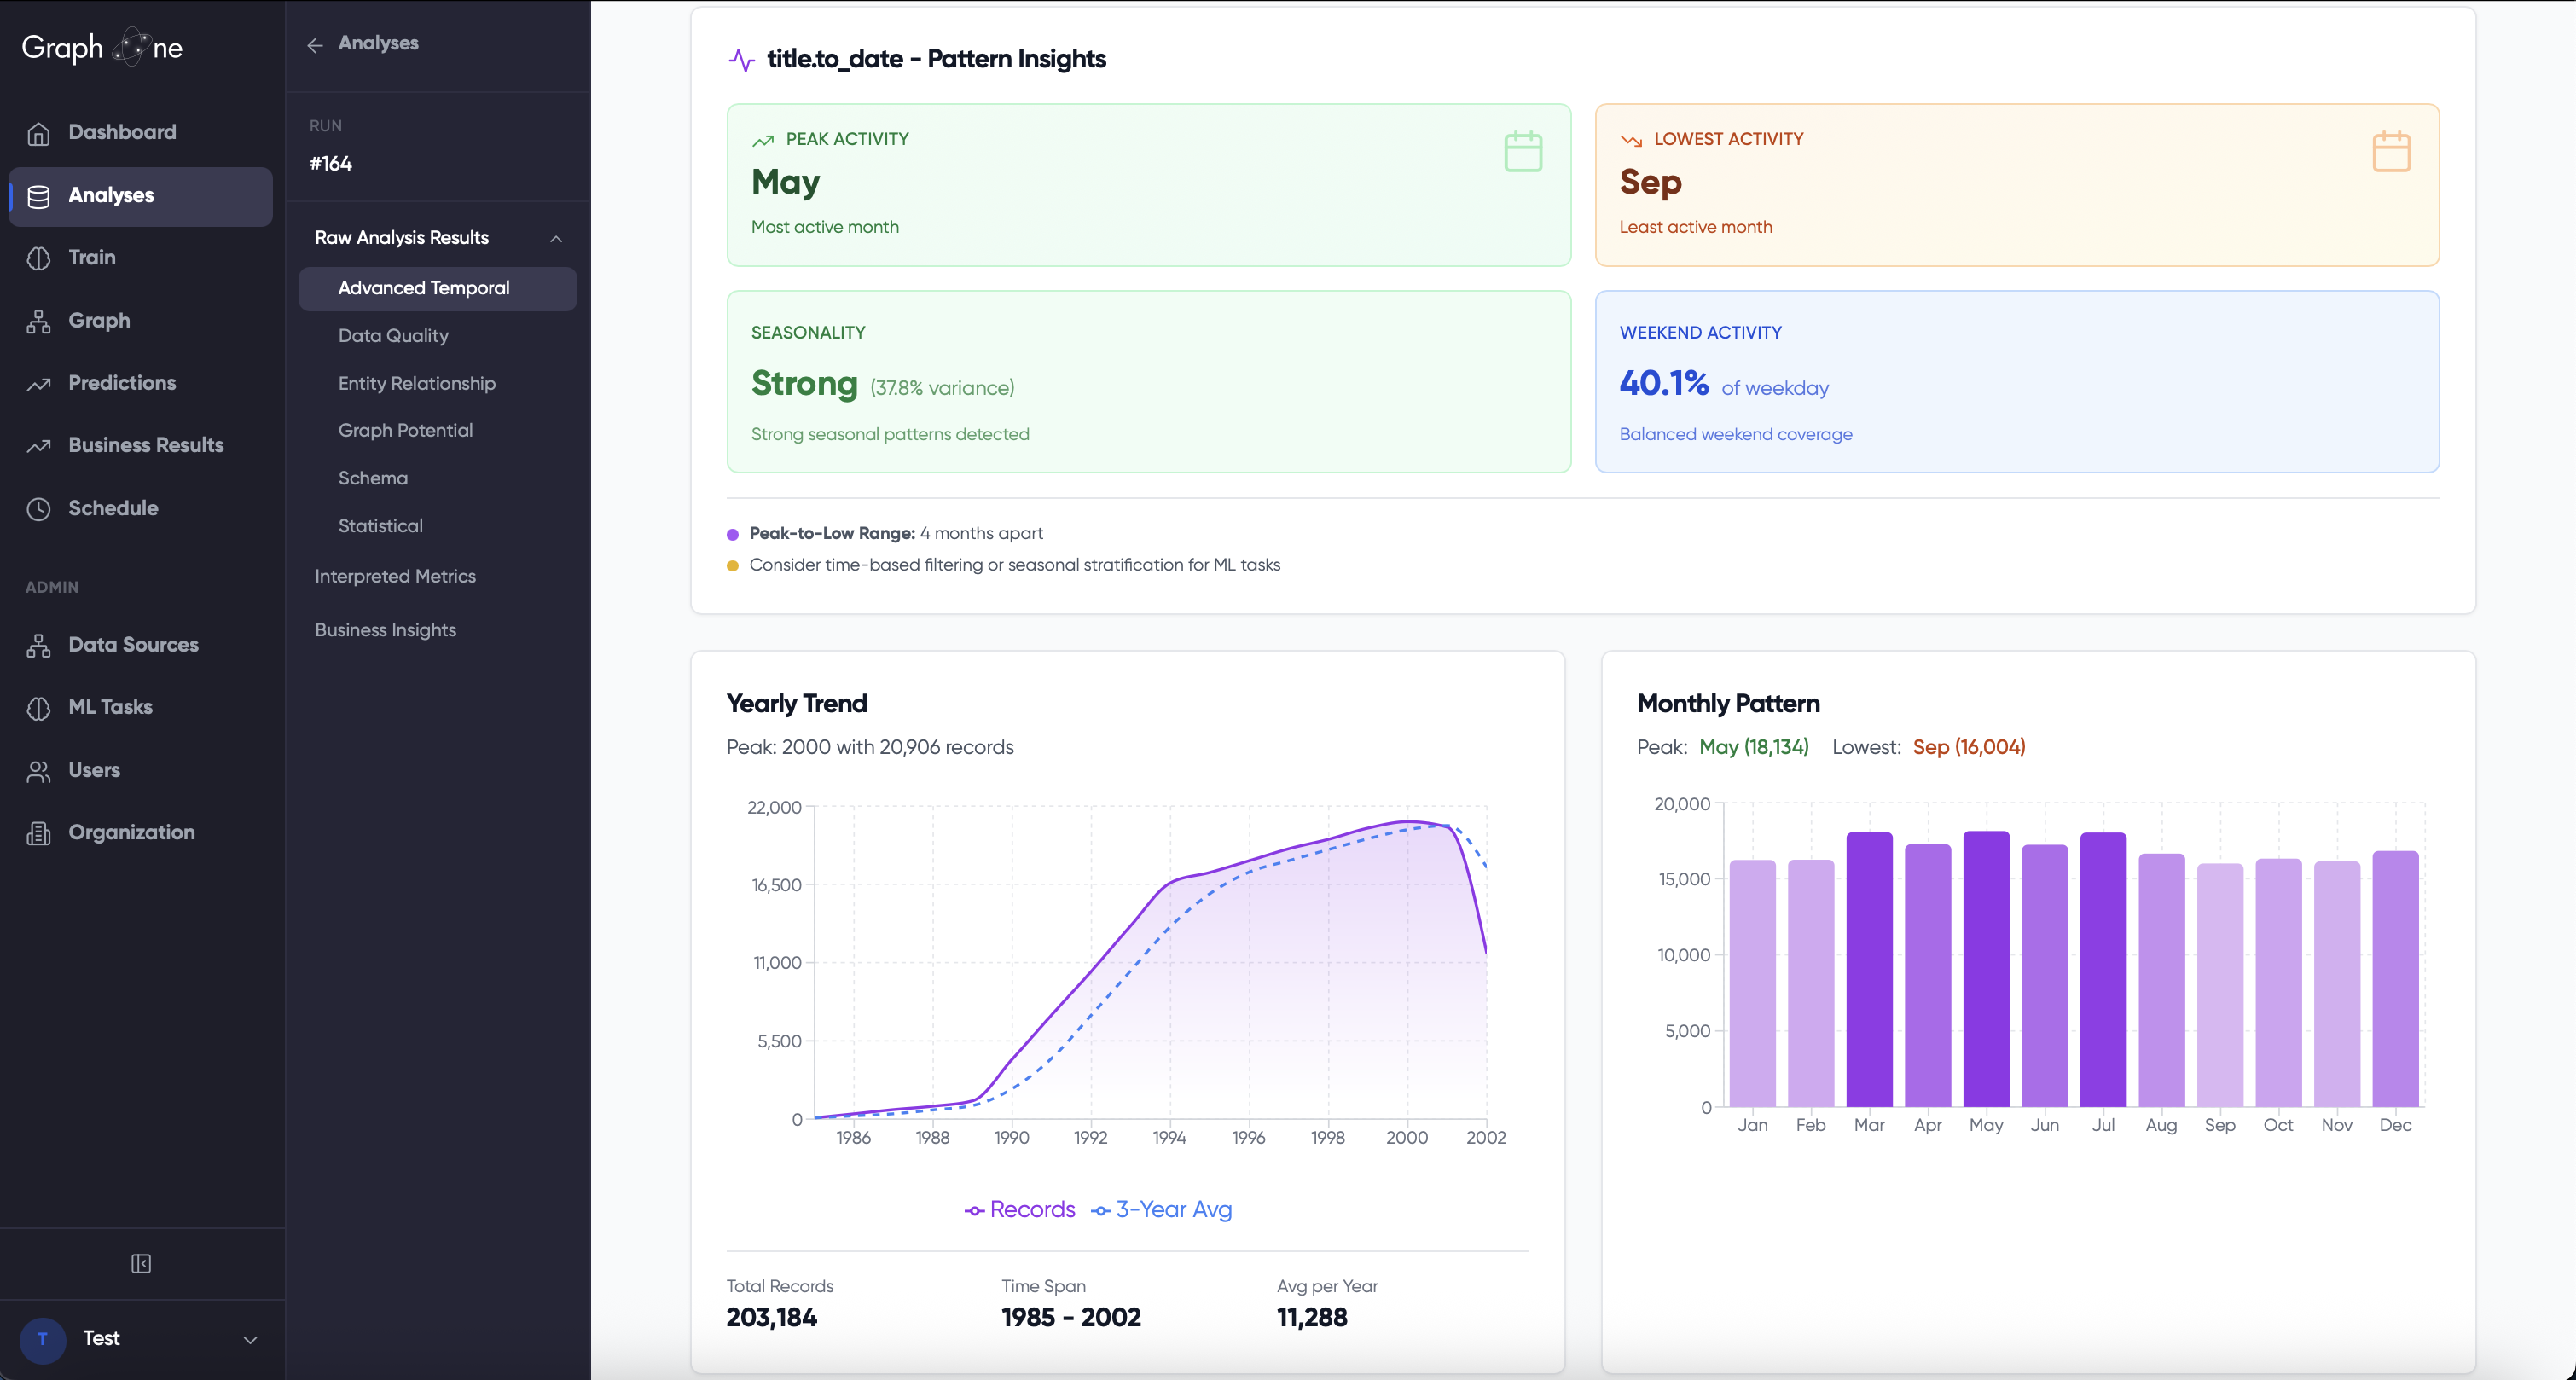
edgelayer automatically discovers and analyses your database structure, identifying relationships, patterns, and opportunities without manual configuration. Connect to your existing databases and watch as it maps the hidden connections between your tables.
No manual feature engineering required. The platform understands your schema, detects relationships, and prepares your data for graph-based learning, all automatically, so your team can focus on insights, not infrastructure.
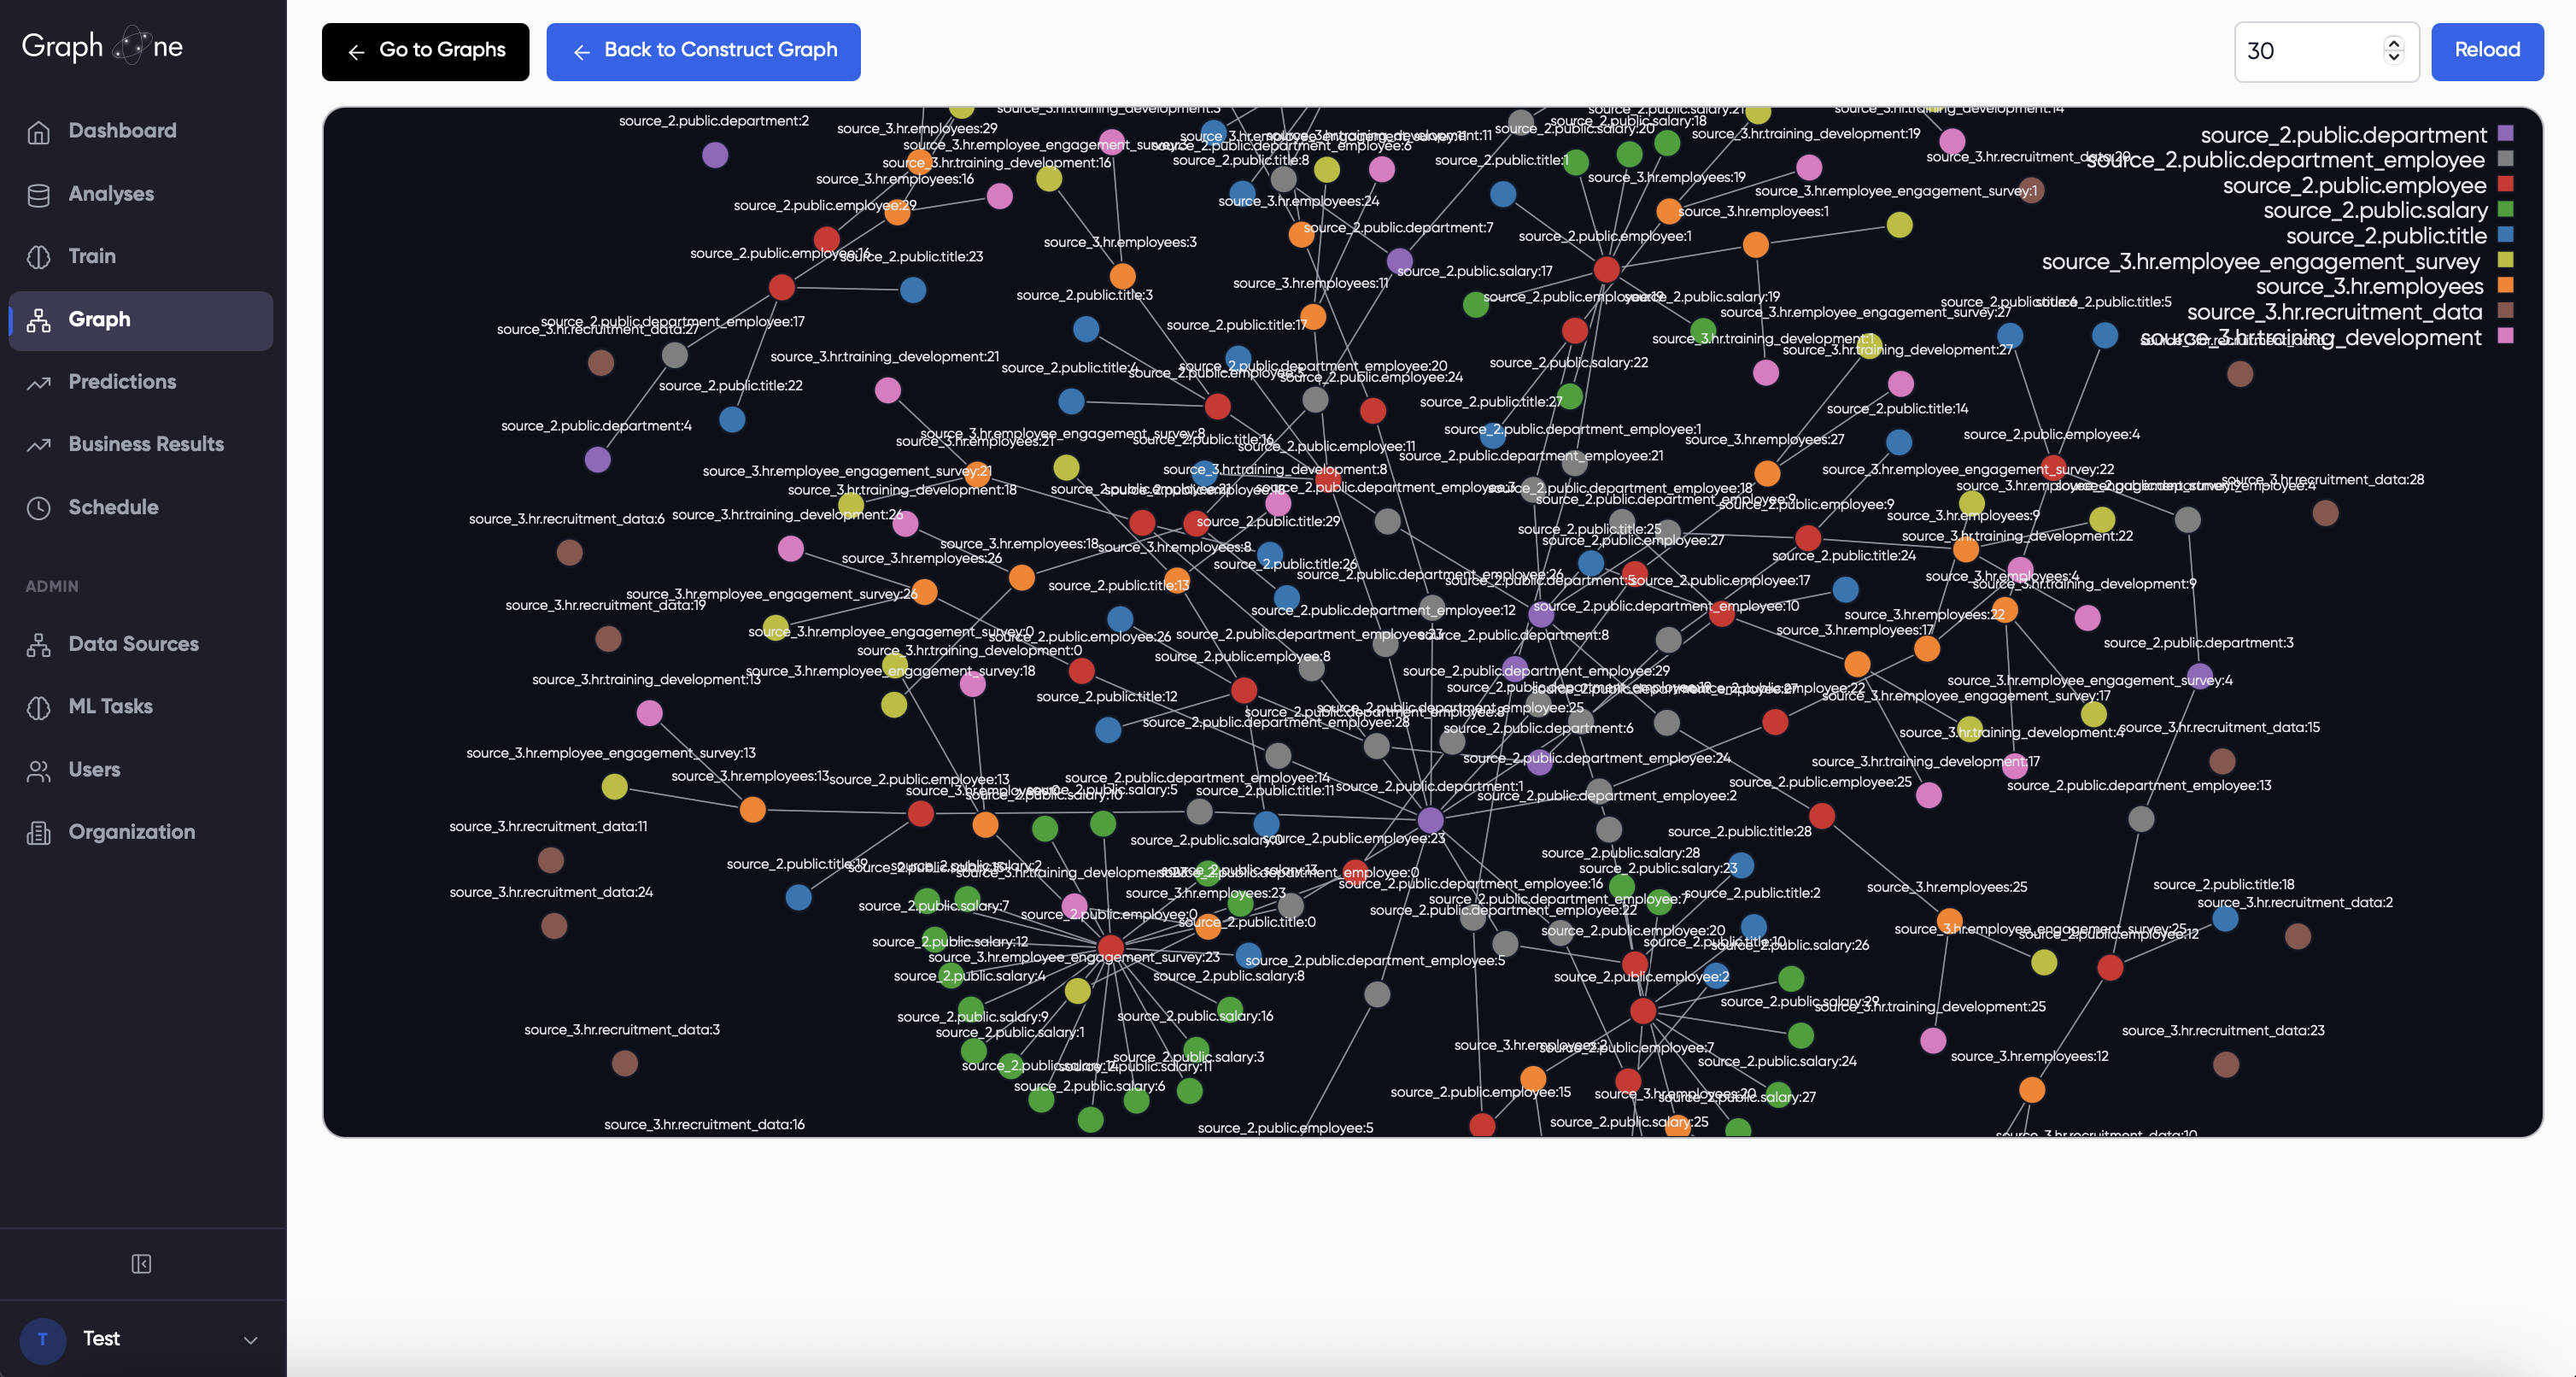
Watch your relational database transform into an interactive graph network. edgelayer visualises the connections between entities, making it easy to understand how your data relates and why certain predictions emerge.
Transparency through visualisation. See exactly which relationships influence predictions, explore the graph structure of your data, and understand the "why" behind every insight, turning complex AI into something your entire team can trust and act upon.
Behind every prediction is a graph engine that reads your schema, discovers how your business fits together, and rebuilds itself as your data grows, no manual mapping, no rigid schema.
Zero manual mapping
Multi-source, safe by default
Native connectors for major databases, warehouses, and file formats. Read-only access, your data never leaves your environment.
Built differently to solve problems that traditional analytics can't.
edgelayer is deployed directly into your own cloud or on-premise environment. We do not ingest, store, or retain your data.
edgelayer augments your existing data and reporting platforms, it does not replace them. No rip-and-replace required.
edgelayer can be deployed quickly inside your environment to demonstrate value using real data. Initial signals and insights are surfaced within days.
edgelayer deploys inside your infrastructure. Your data never leaves your environment, period.
Deployed via Docker in your own cloud or on-premise infrastructure
Read-only connectors. No data is transmitted, stored, or retained externally
Granular permissions with organisation and division scoping
No new regulatory exposure. Existing security and compliance policies remain intact